Car Safety Ratings Explained: What the Data Really Tells You About Crash Survivability
According to the lawyers at Chopin Law, a group of accident attorney New Orleans, when a crash ends up in a courtroom, safety ratings become part of the evidence, cited by attorneys, insurers, and expert witnesses trying to explain what should have happened. Yet most drivers never learn what these numbers really mean until it's too late.
Shopping for a new car often means staring at star ratings and wondering what they actually mean. Are five stars really five times safer than three? The truth is more nuanced than a simple number suggests.
Safety ratings come from crash tests, computer simulations, and real world data. Understanding how these scores get built helps you make a smarter choice for your family instead of just trusting a shiny label on a window sticker.
Who Actually Tests These Cars
Two major organizations dominate car safety testing in the United States. The National Highway Traffic Safety Administration, known as NHTSA, runs government crash tests and assigns star ratings from one to five.
The Insurance Institute for Highway Safety, or IIHS, is funded by insurance companies. Their tests tend to be tougher and more varied, which is why a vehicle can score well with one group and poorly with the other.
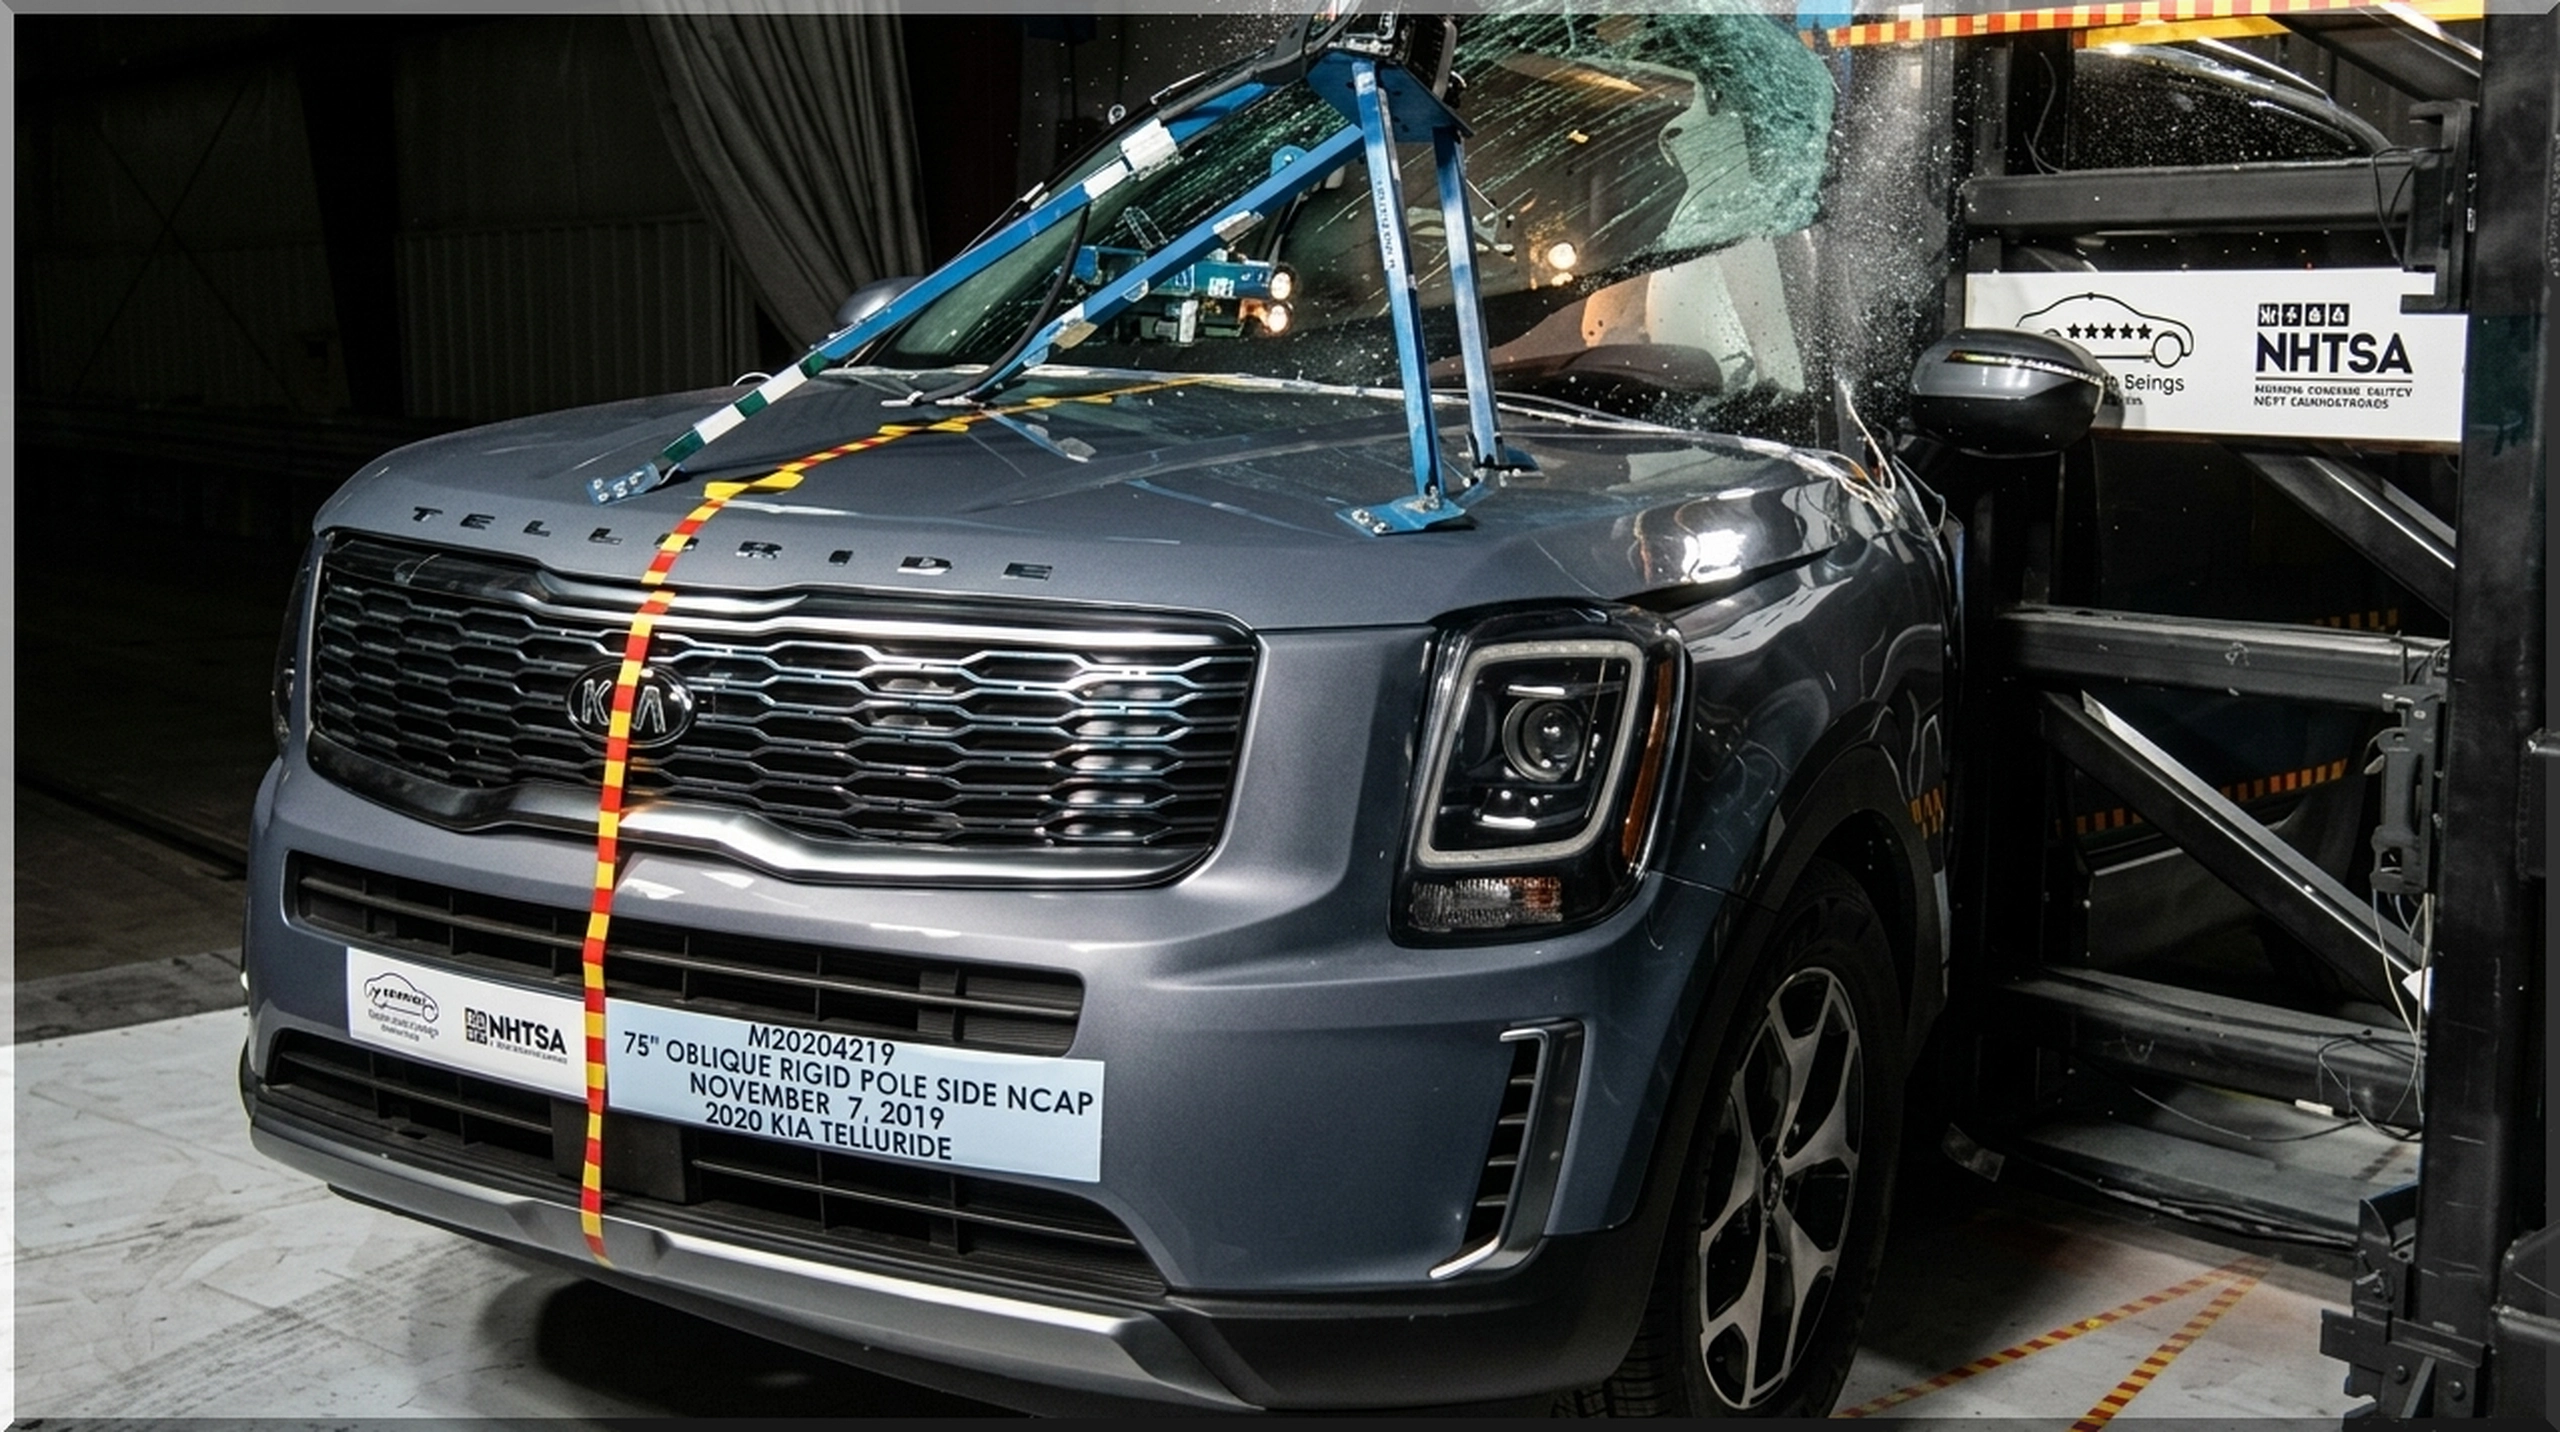
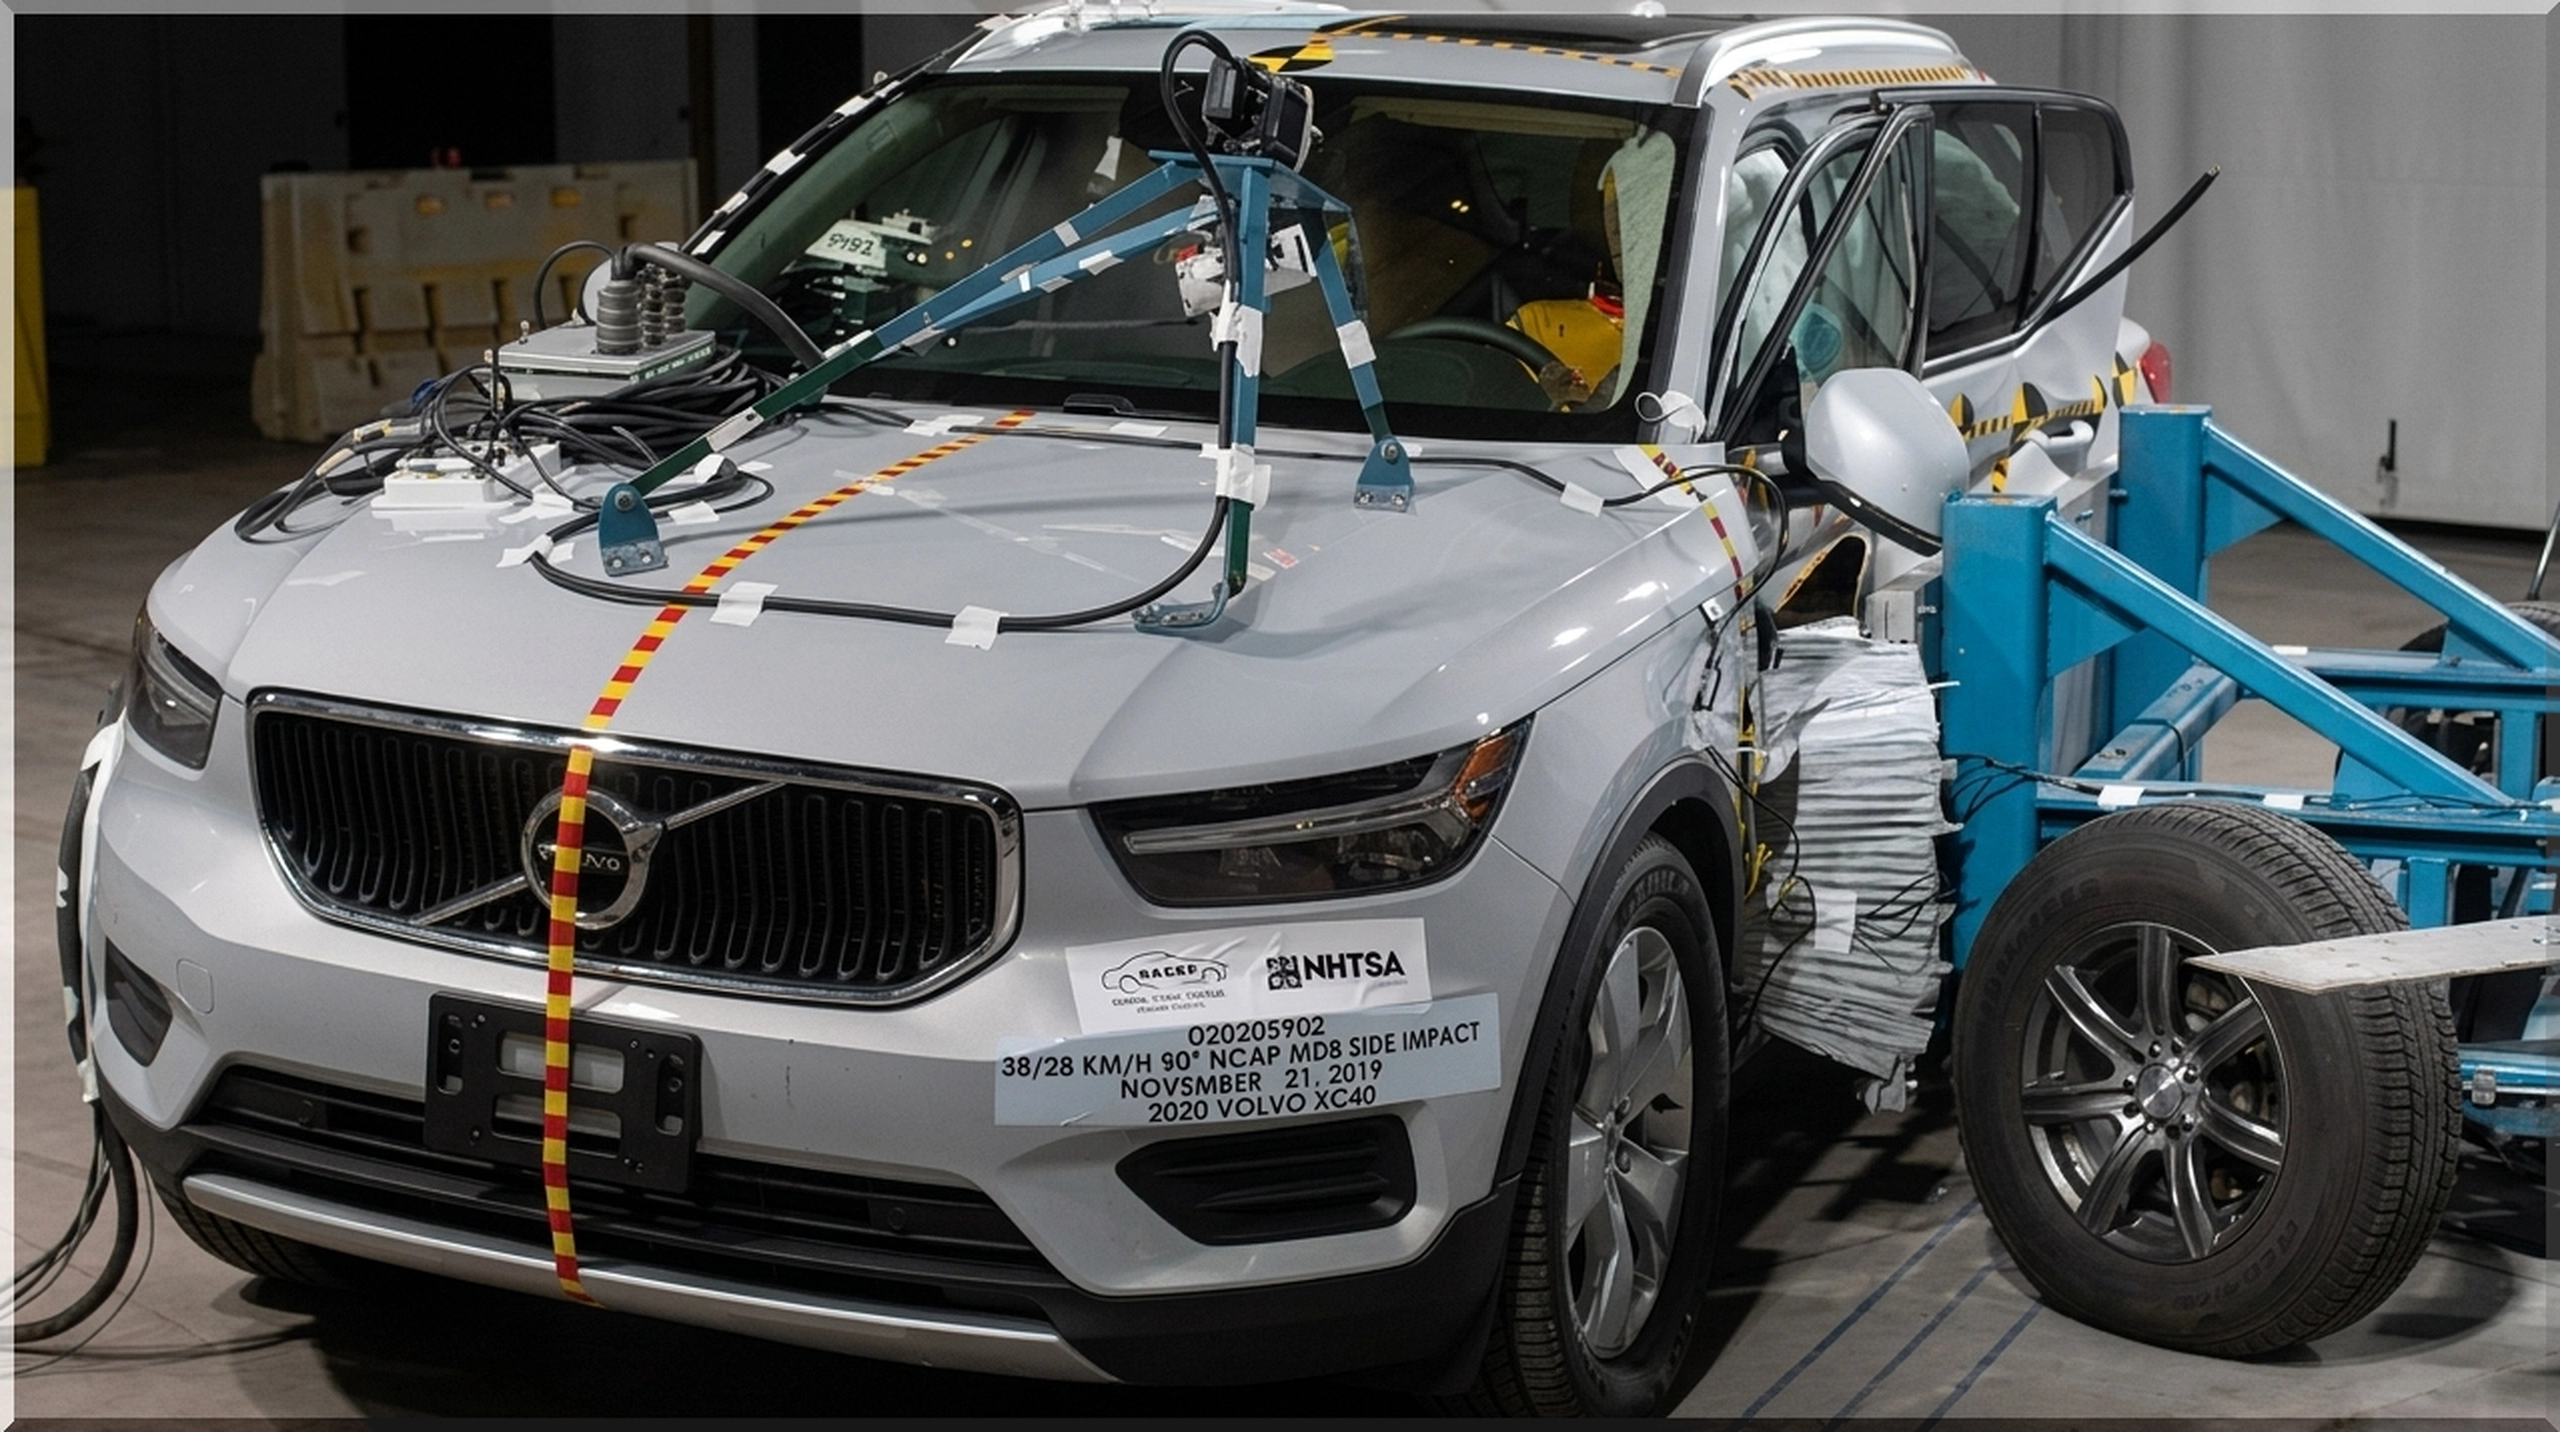
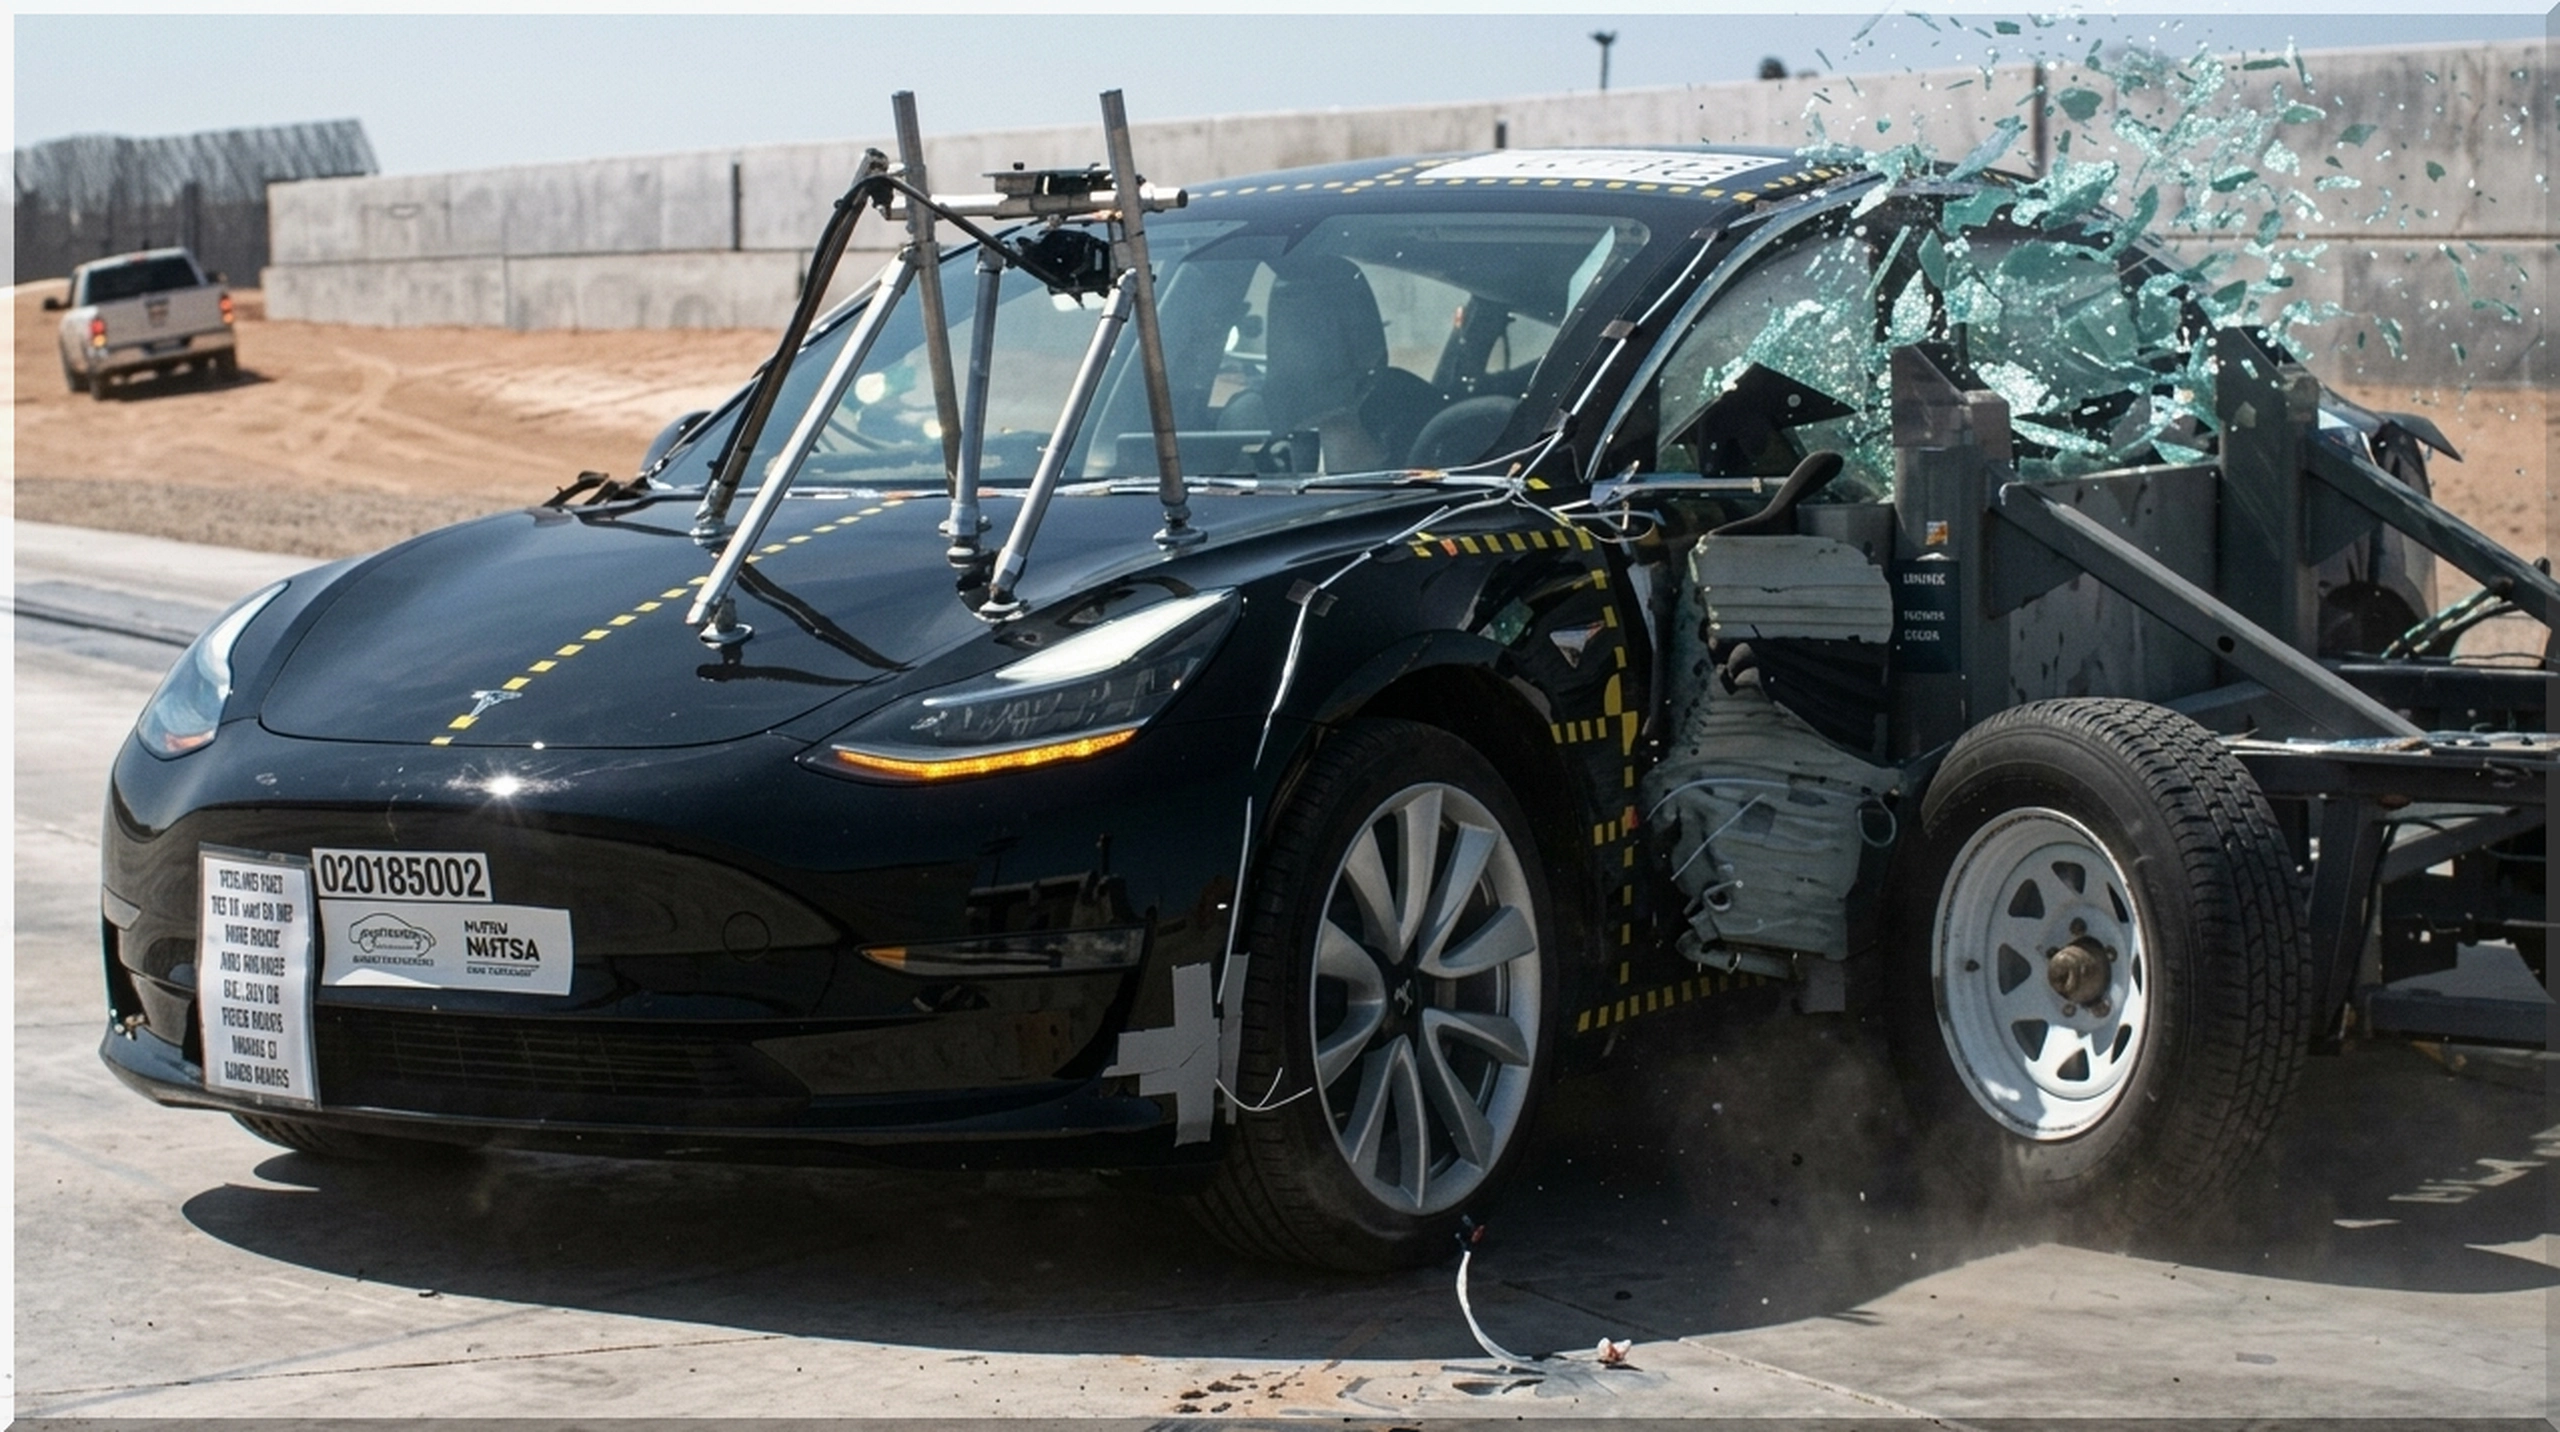
Both organizations crash real vehicles into barriers, walls, and poles at controlled speeds. Sensors inside crash test dummies measure force, impact, and movement, giving engineers a picture of what a human body might experience.
Knowing which organization produced a rating matters. A five star NHTSA score and a Top Safety Pick from IIHS are not interchangeable badges, since each group tests different scenarios and applies different scoring standards.
What The Star Ratings Actually Measure
NHTSA's five star system covers three main areas: frontal crashes, side crashes, and rollover risk. Each area gets its own rating, then they combine into an overall score you see advertised.
A frontal crash test slams the vehicle into a fixed barrier at 35 miles per hour. Side crash tests simulate another vehicle hitting your door area, while rollover ratings estimate how likely a car is to tip over during sharp turns.
Here's the catch: an overall five star rating can hide a weaker score in one specific category. A car might ace the frontal test but only manage three stars for rollover risk, and the average masks that gap.
This is why checking the breakdown matters more than glancing at the overall number. A parent buying a tall SUV should look closely at rollover scores, since taller vehicles carry higher rollover risk by design.
How IIHS Ratings Differ From Government Scores
IIHS uses a different scale entirely. Instead of stars, vehicles earn ratings of Good, Acceptable, Marginal, or Poor across several test categories, including a tricky small overlap frontal test many cars used to fail.
The small overlap test recreates a crash where only the front corner of a car hits a pole or another vehicle. This scenario proved deadly in real accidents even when full frontal tests looked fine, so IIHS added it to close a testing gap.
IIHS also tests headlights, seat and head restraint performance for whiplash injuries, and how well crash prevention technology works, like automatic emergency braking. These extra categories give a fuller picture of everyday crash risks beyond just direct impacts.
To earn a Top Safety Pick or Top Safety Pick Plus award, a vehicle needs strong scores across nearly every category tested. That badge tends to reflect a more complete safety profile than a single star number from NHTSA.
Why Two Cars With The Same Rating Can Behave Differently
Star ratings compare vehicles within similar weight and size classes, not against every car on the road. A five star compact sedan is not necessarily as protective as a five star full size truck in a crash between the two.
Physics still applies regardless of star count. A heavier vehicle generally transfers less force to its occupants when colliding with a lighter one, even if both vehicles carry identical five star safety ratings on paper.
This means a small car and a midsize SUV can each score five stars yet perform very differently if they crash into each other. Ratings tell you how a vehicle performs in a standardized test, not how it fares against every other vehicle out there.
Vehicle design also plays a huge role beyond the label. Crumple zones, airbag placement, seatbelt pretensioners, and the strength of the passenger cabin all shape survivability, and these details do not always show up clearly in a star count.
What The Data Really Tells You About Survival
Crash survivability depends on more than a single number stamped on a sticker. It's a combination of vehicle design, driver behavior, road conditions, and even sheer luck involved in any specific accident.
That said, ratings still carry real value. Vehicles with higher scores consistently show fewer serious injuries and fatalities across large datasets, even though individual results can vary from one crash to the next.
Think of star ratings the same way you would think of a restaurant health score. A high score doesn't guarantee a perfect experience every time, but it does reflect meaningful testing and generally points toward safer choices.
The best approach combines multiple sources of information rather than relying on one score alone. Compare NHTSA and IIHS results, read about specific test categories, and consider how a vehicle fits your actual driving needs and family situation.
Making A Smarter Choice
Next time you're comparing vehicles, resist the urge to only glance at the overall star count. Dig into category breakdowns, compare across both testing organizations, and think about how the vehicle fits into real world traffic patterns near you.
Safety ratings exist to inform your decision, not replace your judgment entirely. Combine that data with your budget, your driving habits, and the specific needs of everyone who will ride along, and you'll land on a genuinely safer choice.
Image gallery
- Add new comment
- 110 views